AWS#12 CloudWatch를 활용한 모니터링
1) CloudWatch?
-CloudWatch는 AWS 사용자들을 위해서 애플리케이션이나 시스템 성능에 대해서 전반적으로 확인하여 변경 사항에 대응할 수 있는 모니터링 시스템
-AWS뿐만이 아닌 온프레미스 서버에서 관리되는 애플리케이션이나 시스템 성능 또한 수집 가능함
-문제나 장애 발생시 경보를 설정 하여 알림을 받읈 수 있고 지표를 시각화 하여 한 눈에 파악할 수 있으며 자동화된 작업 수행이 가능함
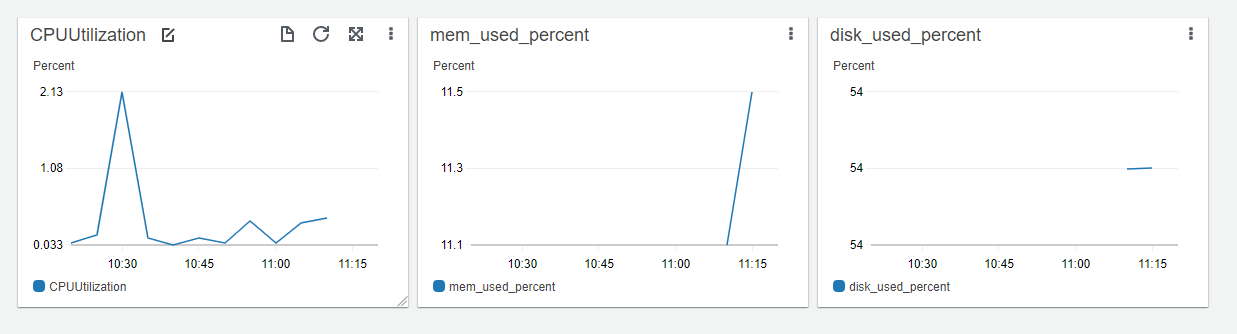
2) EC2 인스턴스 모니터링(CPU)


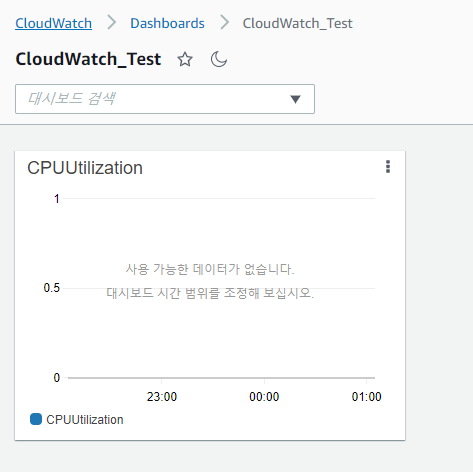
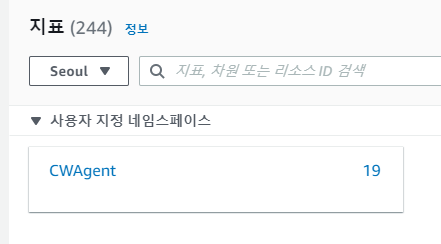
이렇게 지표를 생성하고 CPU 사용률에 대한 평균값, 최대값, 최소값 등등을 얻을 수 있음
하지만 서버의 기본적인 메모리, 디스크 사용률에 대한 지표를 제공하지 않기 때문에
서버에 접속해 CloudWatch Agent를 설치하는 과정을 거쳐야 함
3) EC2 인스턴스 모니터링(메모리, 디스크)
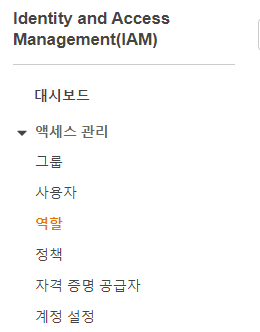
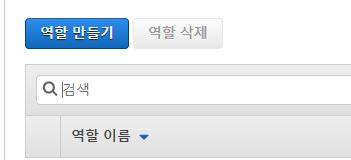
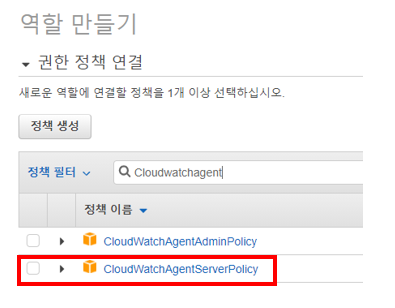
-IAM 역할 생성
인스턴스가 CloudWatch Agent의 데이터를 수집할 수 있게 역할을 생성


명령줄을 사용하여 CloudWatch 에이전트 다운로드 및 구성 - Amazon CloudWatch
이 페이지에 작업이 필요하다는 점을 알려 주셔서 감사합니다. 실망시켜 드려 죄송합니다. 잠깐 시간을 내어 설명서를 향상시킬 수 있는 방법에 대해 말씀해 주십시오.
docs.aws.amazon.com
위 링크에서 CloudWatch Agent를 각 OS에 맞게 다운받음

wget을 통해 다운로드 (Amazon Linux)
[root@linux_test ~]# wget https://s3.amazonaws.com/amazoncloudwatch-agent/amazon_linux/amd64/latest/amazon-cloudwatch-agent.rpm
패키지 설치(내려 받은 파일)
[root@linux_test ~]# rpm -ivh amazon-cloud-watch-agent.rpm
Agent 구성 마법사 실행
[root@linux_test ~]# /opt/aws/amazon-cloudwatch-agent/bin/amazon-cloudwatch-agent-config-wizard
=============================================================
= Welcome to the AWS CloudWatch Agent Configuration Manager =
=============================================================
On which OS are you planning to use the agent?
1. linux
2. windows
3. darwin
default choice: [1]:
1
Trying to fetch the default region based on ec2 metadata...
Are you using EC2 or On-Premises hosts?
1. EC2
2. On-Premises
default choice: [1]:
1
Which user are you planning to run the agent?
1. root
2. cwagent
3. others
default choice: [1]:
1
Do you want to turn on StatsD daemon?
1. yes
2. no
default choice: [1]:
2
Do you want to monitor metrics from CollectD?
1. yes
2. no
default choice: [1]:
2
Do you want to monitor any host metrics? e.g. CPU, memory, etc.
1. yes
2. no
default choice: [1]:
1
Do you want to monitor cpu metrics per core? Additional CloudWatch charges may apply.
1. yes
2. no
default choice: [1]:
2
Do you want to add ec2 dimensions (ImageId, InstanceId, InstanceType, AutoScalingGroupName) into all of your metrics if the info is available?
1. yes
2. no
default choice: [1]:
1
Would you like to collect your metrics at high resolution (subminute resolution)? This enables sub-minute resolution for all metrics, but you can customize for specific metrics in the output json file.
1. 1s
2. 10s
3. 30s
4. 60s
default choice: [4]:
4
Which default metrics config do you want?
1. Basic
2. Standard
3. Advanced
4. None
default choice: [1]:
1
Are you satisfied with the above config? Note: it can be manually customized after the wizard completes to add additional items.
1. yes
2. no
default choice: [1]:
1
Do you have any existing CloudWatch Log Agent configuration file to import for migration?
1. yes
2. no
default choice: [2]:
2
Do you want to monitor any log files?
1. yes
2. no
default choice: [1]:
2
Do you want to store the config in the SSM parameter store?
1. yes
2. no
default choice: [1]:
2
CloudWatch Agent 실행
[root@linux_test ~]# /opt/aws/amazon-cloudwatch-agent/bin/amazon-cloudwatch-agent-ctl -a fetch-config -m ec2 -c file:/opt/aws/amazon-cloudwatch-agent/bin/config.json -s


4) EC2 프로세스 모니터링
테스트할 프로세스 다운 및 실행
[root@linux_test ~]# yum -y install httpd
[root@linux_test ~]# systemctl start httpd
설정값 수정
(metrics, metrics_collected 아래 procstat으로 작성)
-cpu_usage: 프로세스의 cpu 사용률
-pid_count: 해당 프로세스의 실행 수
[root@linux_test ~]# vim /opt/aws/amazon-cloudwatch-agent/bin/config.json
{
"metrics": {
"metrics_collected": {
"procstat": [
{
"exe": "httpd",
"measurement": [
"cpu_usage",
"pid_count"
]
}
]
}
}
}
CloudWatch Agent 설정 값 저장 및 재실행
[root@linux_test ~]# /opt/aws/amazon-cloudwatch-agent/bin/amazon-cloudwatch-agent-ctl -a fetch-config -m ec2 -c file:/opt/aws/amazon-cloudwatch-agent/bin/config.json -s


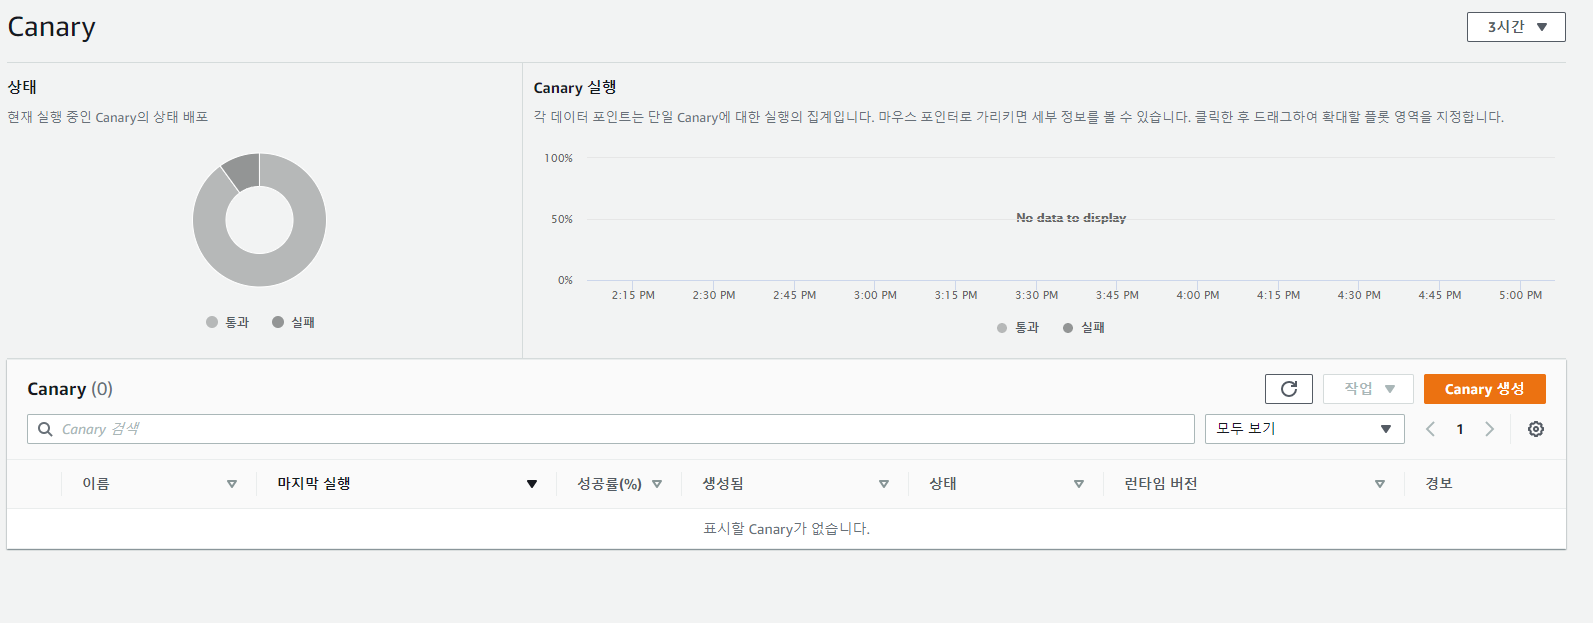
5) URL 모니터링
-원하는 url의 상태를 체크할 수있음